File Analysis and Data Panel
Drag File Analysis
You can drag Excel (.xlsx, .xls) or CSV files directly into the conversation page. A fullscreen overlay will appear when dragging:
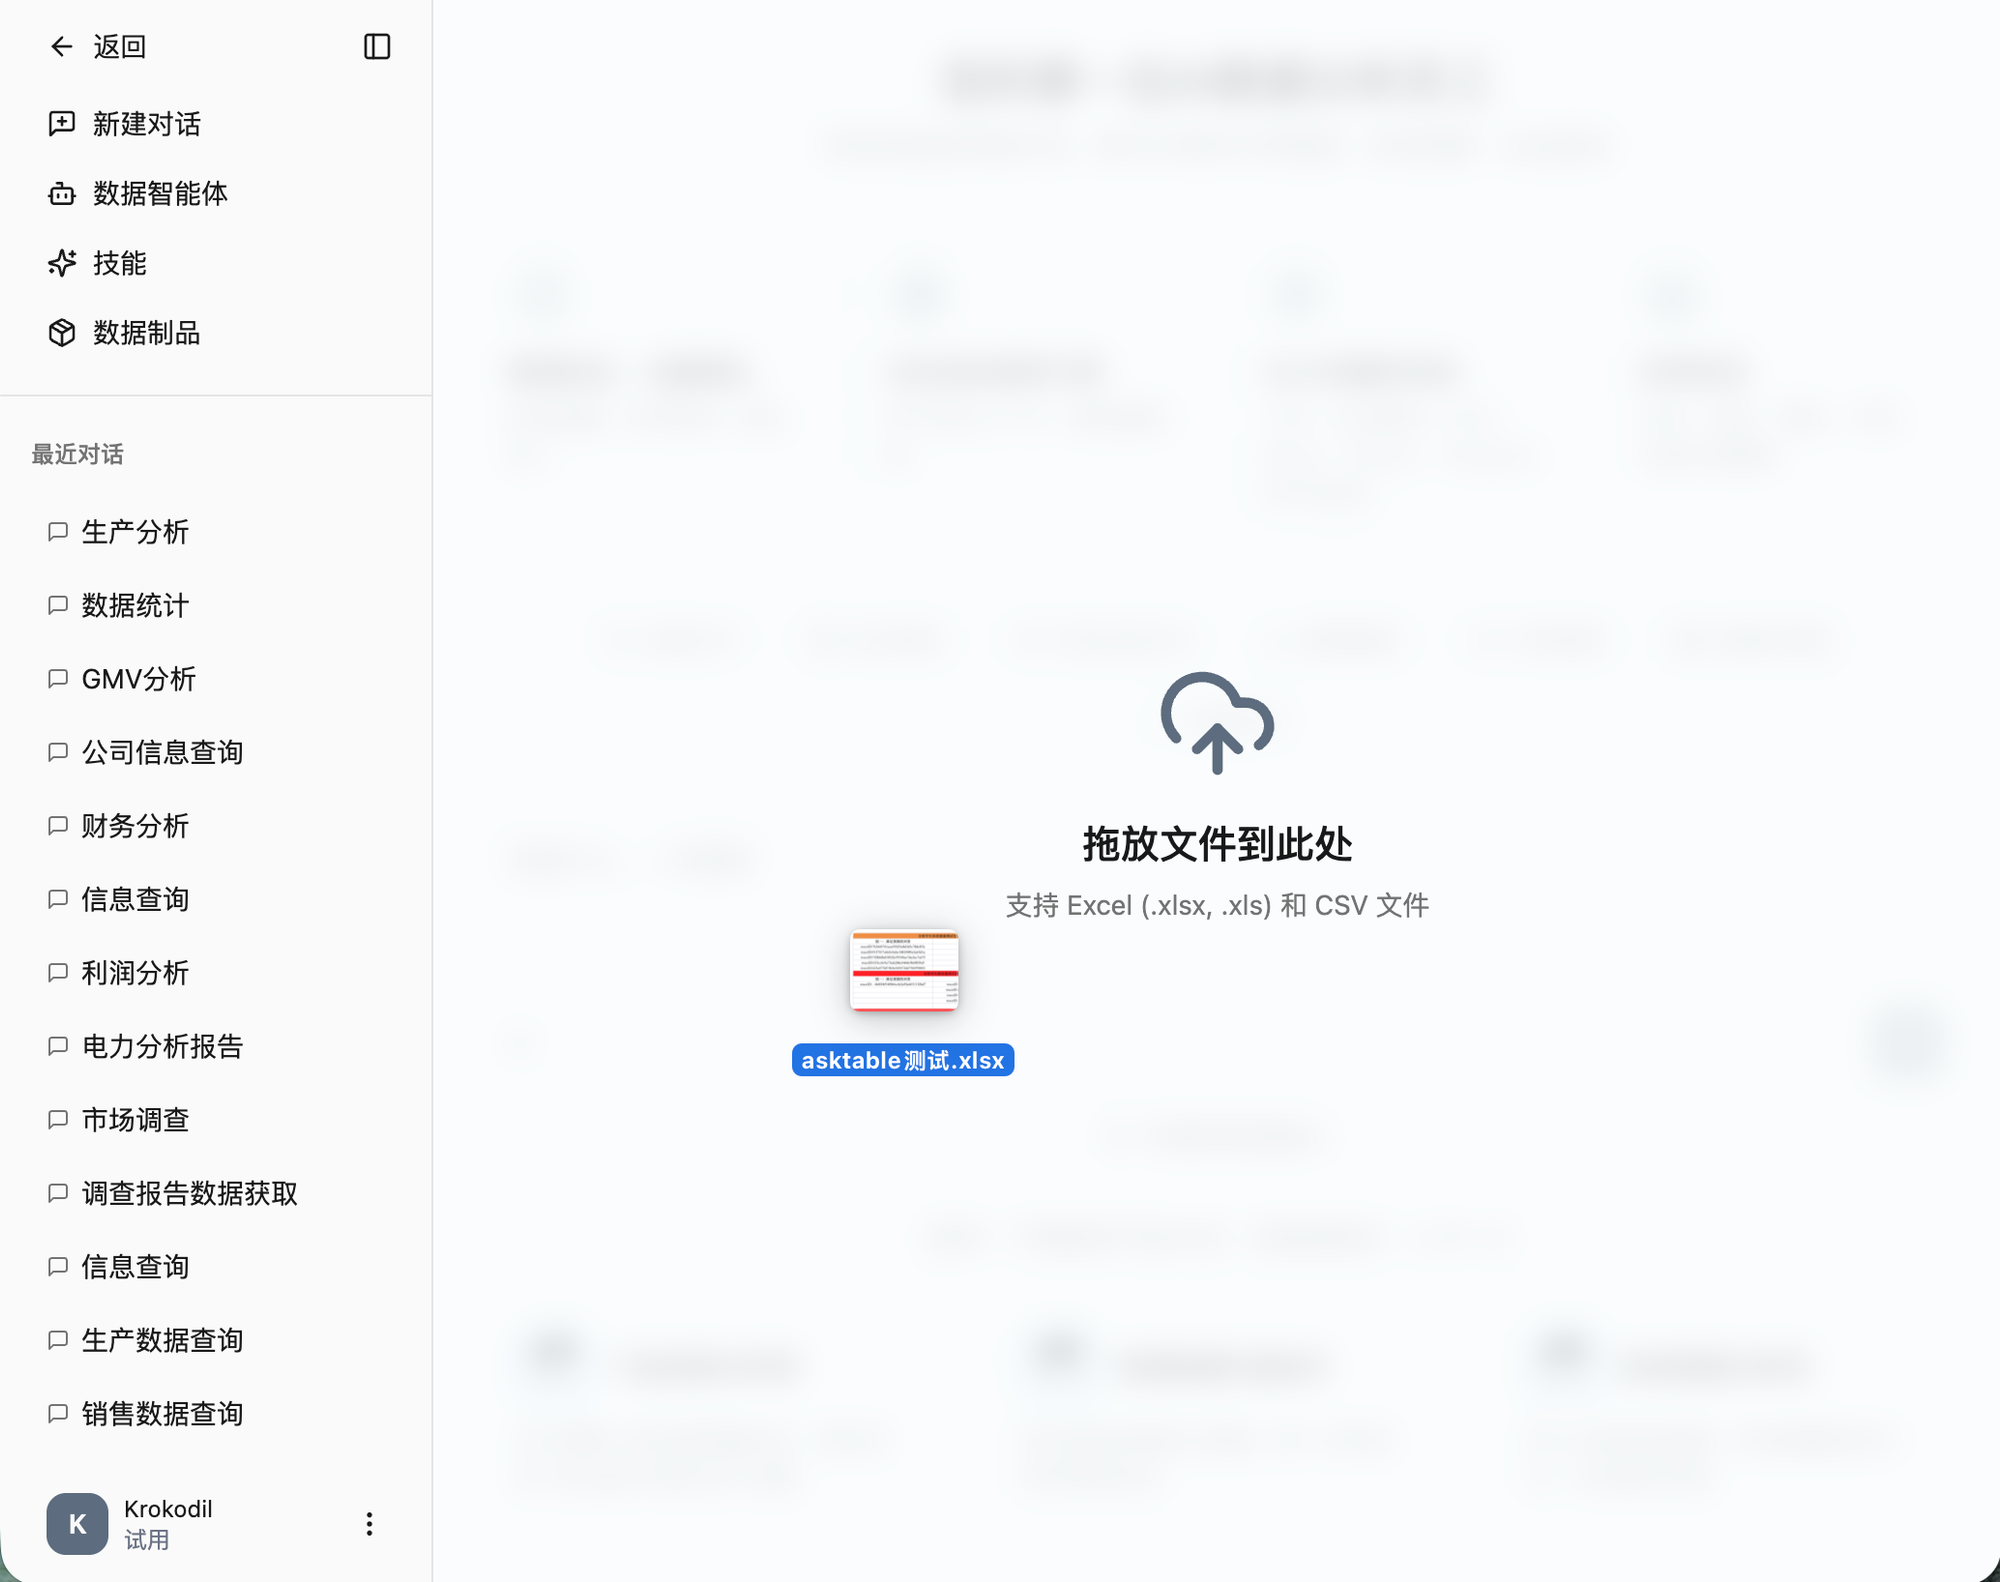
After the file is loaded, it appears as an attachment in the input box, and you can ask questions directly based on its content.
Skill Slash Command
Type / in the input box to trigger the skill selection menu. Type the skill name and press Enter to select it, which automatically enables the skill for the conversation.
Data Panel
After the AI returns analysis results, it also generates data artifacts. Click on a chart or table in the results to open the data panel on the right.
The data panel supports two views:
- Table view — Shows the full data table with search and pagination
- Chart view — Shows a visualization, editable for chart type, colors, axis labels, etc.
Chart Editing
In the chart view, you can edit:
- Chart type — Bar, line, area, scatter, pie
- Visual style — Rounded/sharp, theme color selection
- Chart options — Legend, axes, data labels, grid lines
- Axis configuration — X-axis, Y-axis, color grouping
Action Menu
Click the dropdown menu at the top-right of the data panel for:
- Copy table — Copy data to clipboard
- Copy chart image — Copy chart as an image
- Copy chart SVG — Copy chart as SVG code
- Download CSV — Export data as a CSV file